

Monitoring call analytics is an important part of the job for a call center supervisor. The data found there will help you to make fact-based decisions about staffing, training your call agents, and improving your callers’ experience.
Where can you find these analytics, and what type of call metrics do they track? We’ve compiled the answers to those questions below.
Common Call Center Analytics
You’ll find a wide variety of calling stats and figures in queue dashboards. Here are a handful of key metrics and what they mean for your business:
Number of Callers Waiting in the Queue
This stat is the number of calls that are currently waiting in the queue to be answered by your call agents.
Call With the Maximum Wait Time
This stat displays the call, currently on hold in the queue, that has been waiting the longest. A running timer lets you know how long the call has been on hold.
Number of Calls That Are Currently Being Answered by Agents
This shows the number of callers that are currently in conversations with call agents.
Number of Calls That Were Abandoned
This stat tells you the number of callers who ended their calls (i.e., hung up the phone) while they were waiting on hold and before agents had a chance to answer.
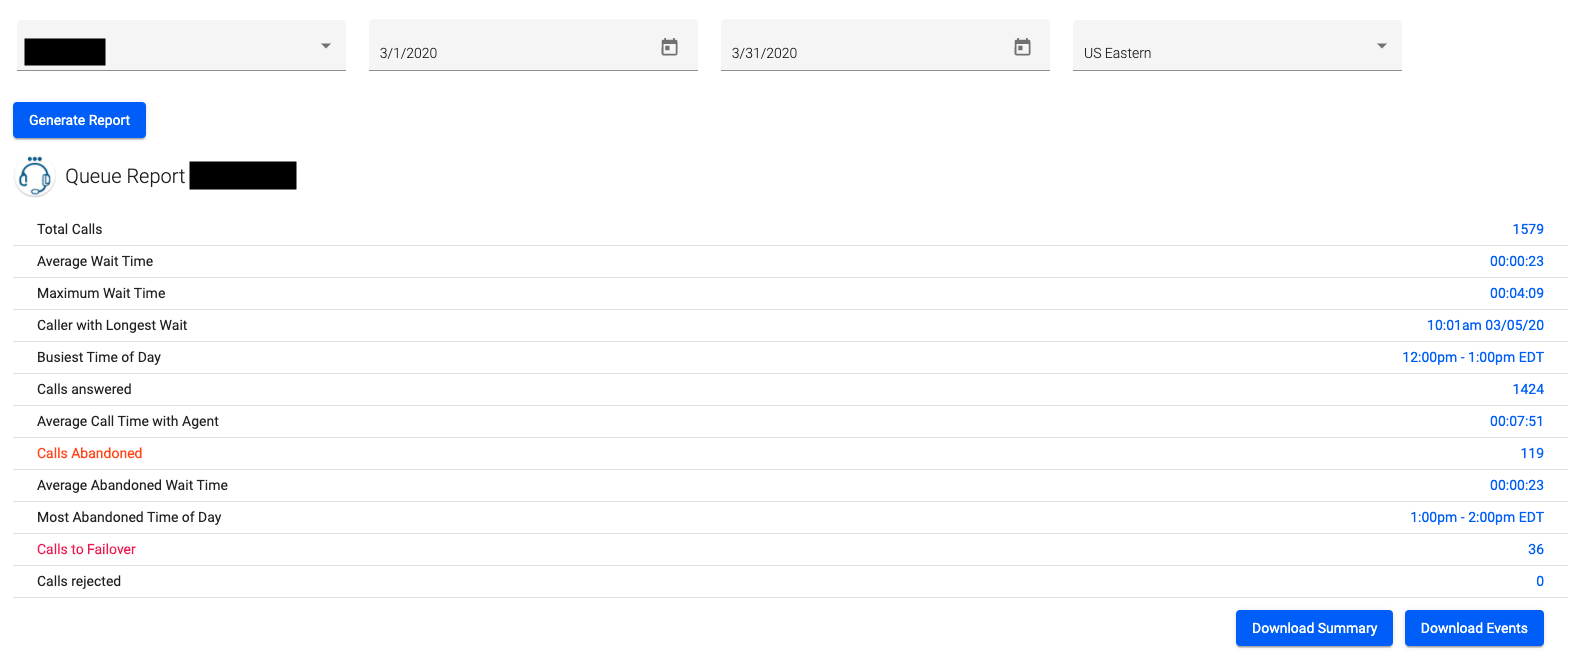
Average Wait Time
After a supervisor selects a specific time period, this figure shows you the average amount of time a call was on hold before an agent answered it.
Maximum Wait Time
After a supervisor selects a specific time period, this number is the max amount of time a call was on hold before an agent answered it.
Busiest Time of Day
After a supervisor selects a specific time period, this piece of data tells you the time of day (usually in hour increments) when the greatest number of calls to the queue was received.
Most Abandoned Time of Day
After a supervisor selects a specific time period, this stat tells you the time of day (usually in hour increments) when the greatest number of callers in the queue hung up their calls before agents had a chance to answer.
Average Call Time With Agent
After a supervisor selects a specific time period, this shows the average length of time that it took for agents to complete calls with callers.
Average Abandoned Wait Time
After a supervisor selects a specific time period, this number is the average amount of time that callers were waiting on hold before they hung up their calls.
Calls to Failover
After a supervisor selects a specific time period, this stat is the total number of calls that went to your queue’s failover destination (a voice mailbox, a supervisor’s phone, an attendant menu, etc.) instead of being answered by agents.
Find these Stats in a Call Center Metrics Dashboard
There are many types of business calling analytics that a call center (and any company, for that matter) can track. Typically, they’re neatly compiled in a web browser-based or desktop application dashboard, with call metrics and stats that update in real-time.
These dashboards are connected to ACD queues, an inbound calling feature that funnels callers to reps and holds callers in line if all reps are busy on calls. The call center metrics dashboard displays how callers are interacting with the queue as well as how agents are handling calls.
In addition to seeing real-time queue data, supervisors can also download reports for user-selected dates. These reports assemble KPIs for the selected time period and help supervisors discover and track call patterns. Reports are typically made available as CSV or XLS files.
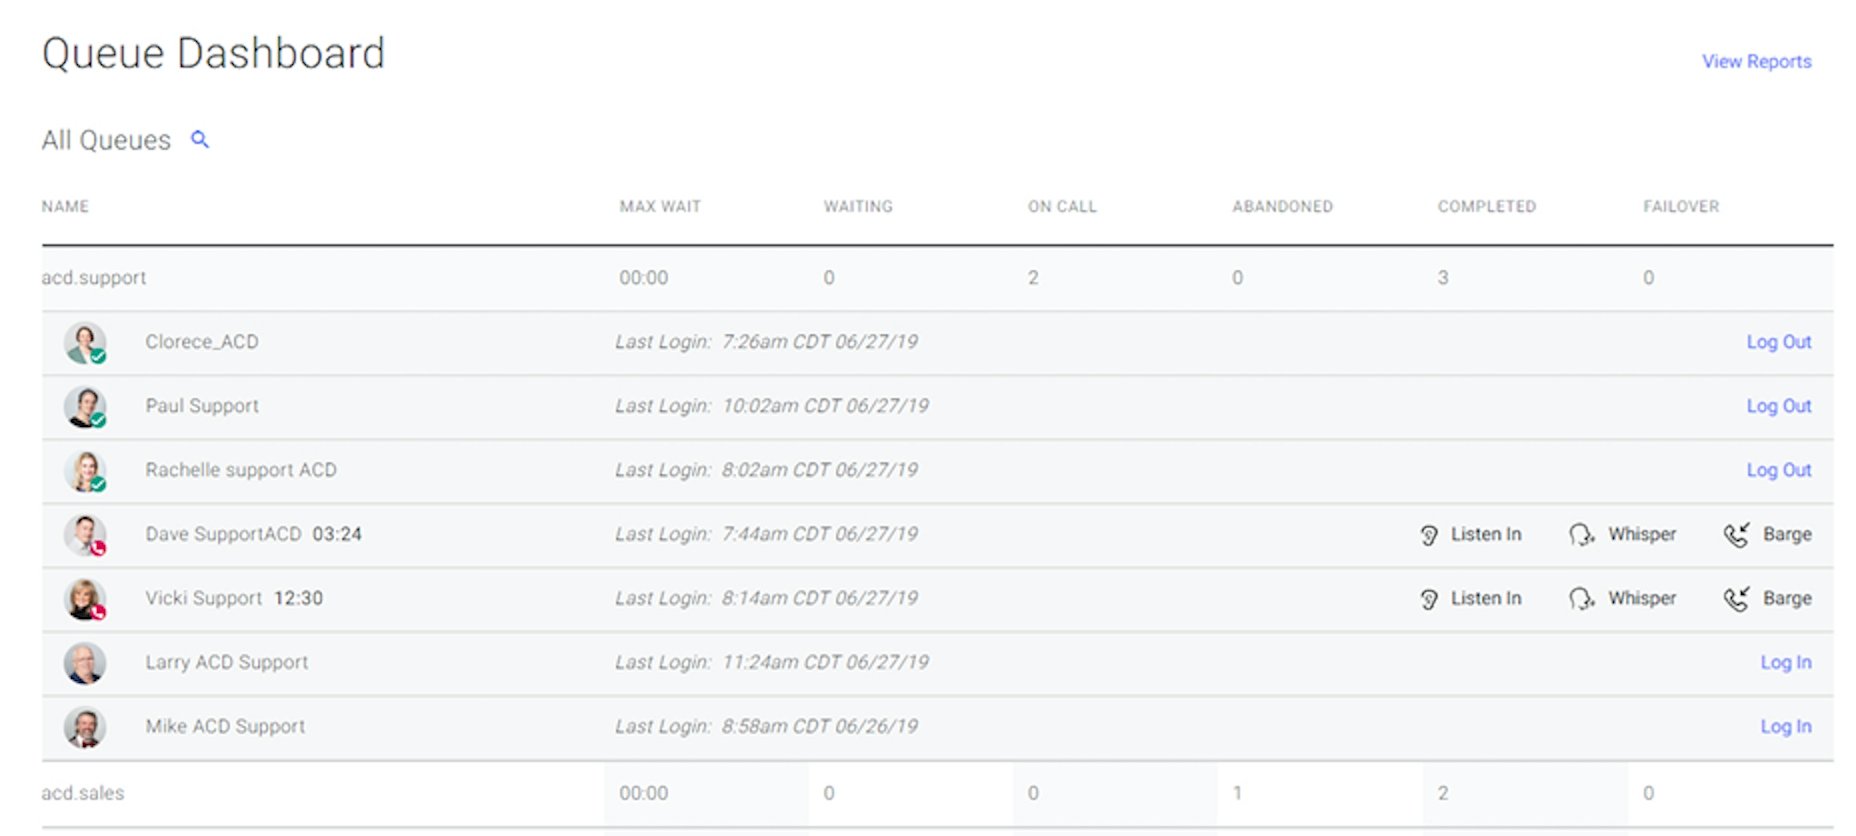
OnSIP’s Enhanced Queue Dashboard is found within the OnSIP app. A call center supervisor can log into the web browser or desktop application version of our app to view the dashboard and keep tabs on their queues throughout the day. In addition to the real-time overview and historical reports sections of the dashboard, supervisors can also use call monitoring features like monitor, whisper, and barge to aid agents on calls and provide a second level of support for callers.
Further Reading: Related Blog Posts
How can you use call center analytics like the ones mentioned above to benefit your business? Discover the answers in these other blogs: